Contents
Keeping track of tasks helps in many ways. Remember the milk - check. Get things done - check. Build healthy habits - check. Get an overview of your progress - check. Control your life - well, that’s arguably possible. Feel more of contentment and accomplishment - check!
In this article I’m going to share the framework I’ve been using for organizing my tasks over the last few years. I don’t insist you should use this framework or this specific application, but maybe it will give you some inspiration. Or maybe you can share a couple of inspirational tips with me.
After describing the framework itself, there are a couple of sections on how I use Google Keep API to collect statistics and apply a data driven approach to progress tracking. And the same API can be used to automate routine operations, such as adding repetitive lists.
Why Google Keep?
I’ve been using Google Keep for note taking and structuring my personal information since 2014. Over the last couple of years I’ve also been putting my TODO lists there. If you’re not a Google Keep user, or want to have an idea of how a Google Keep board looks like, here is a preview:
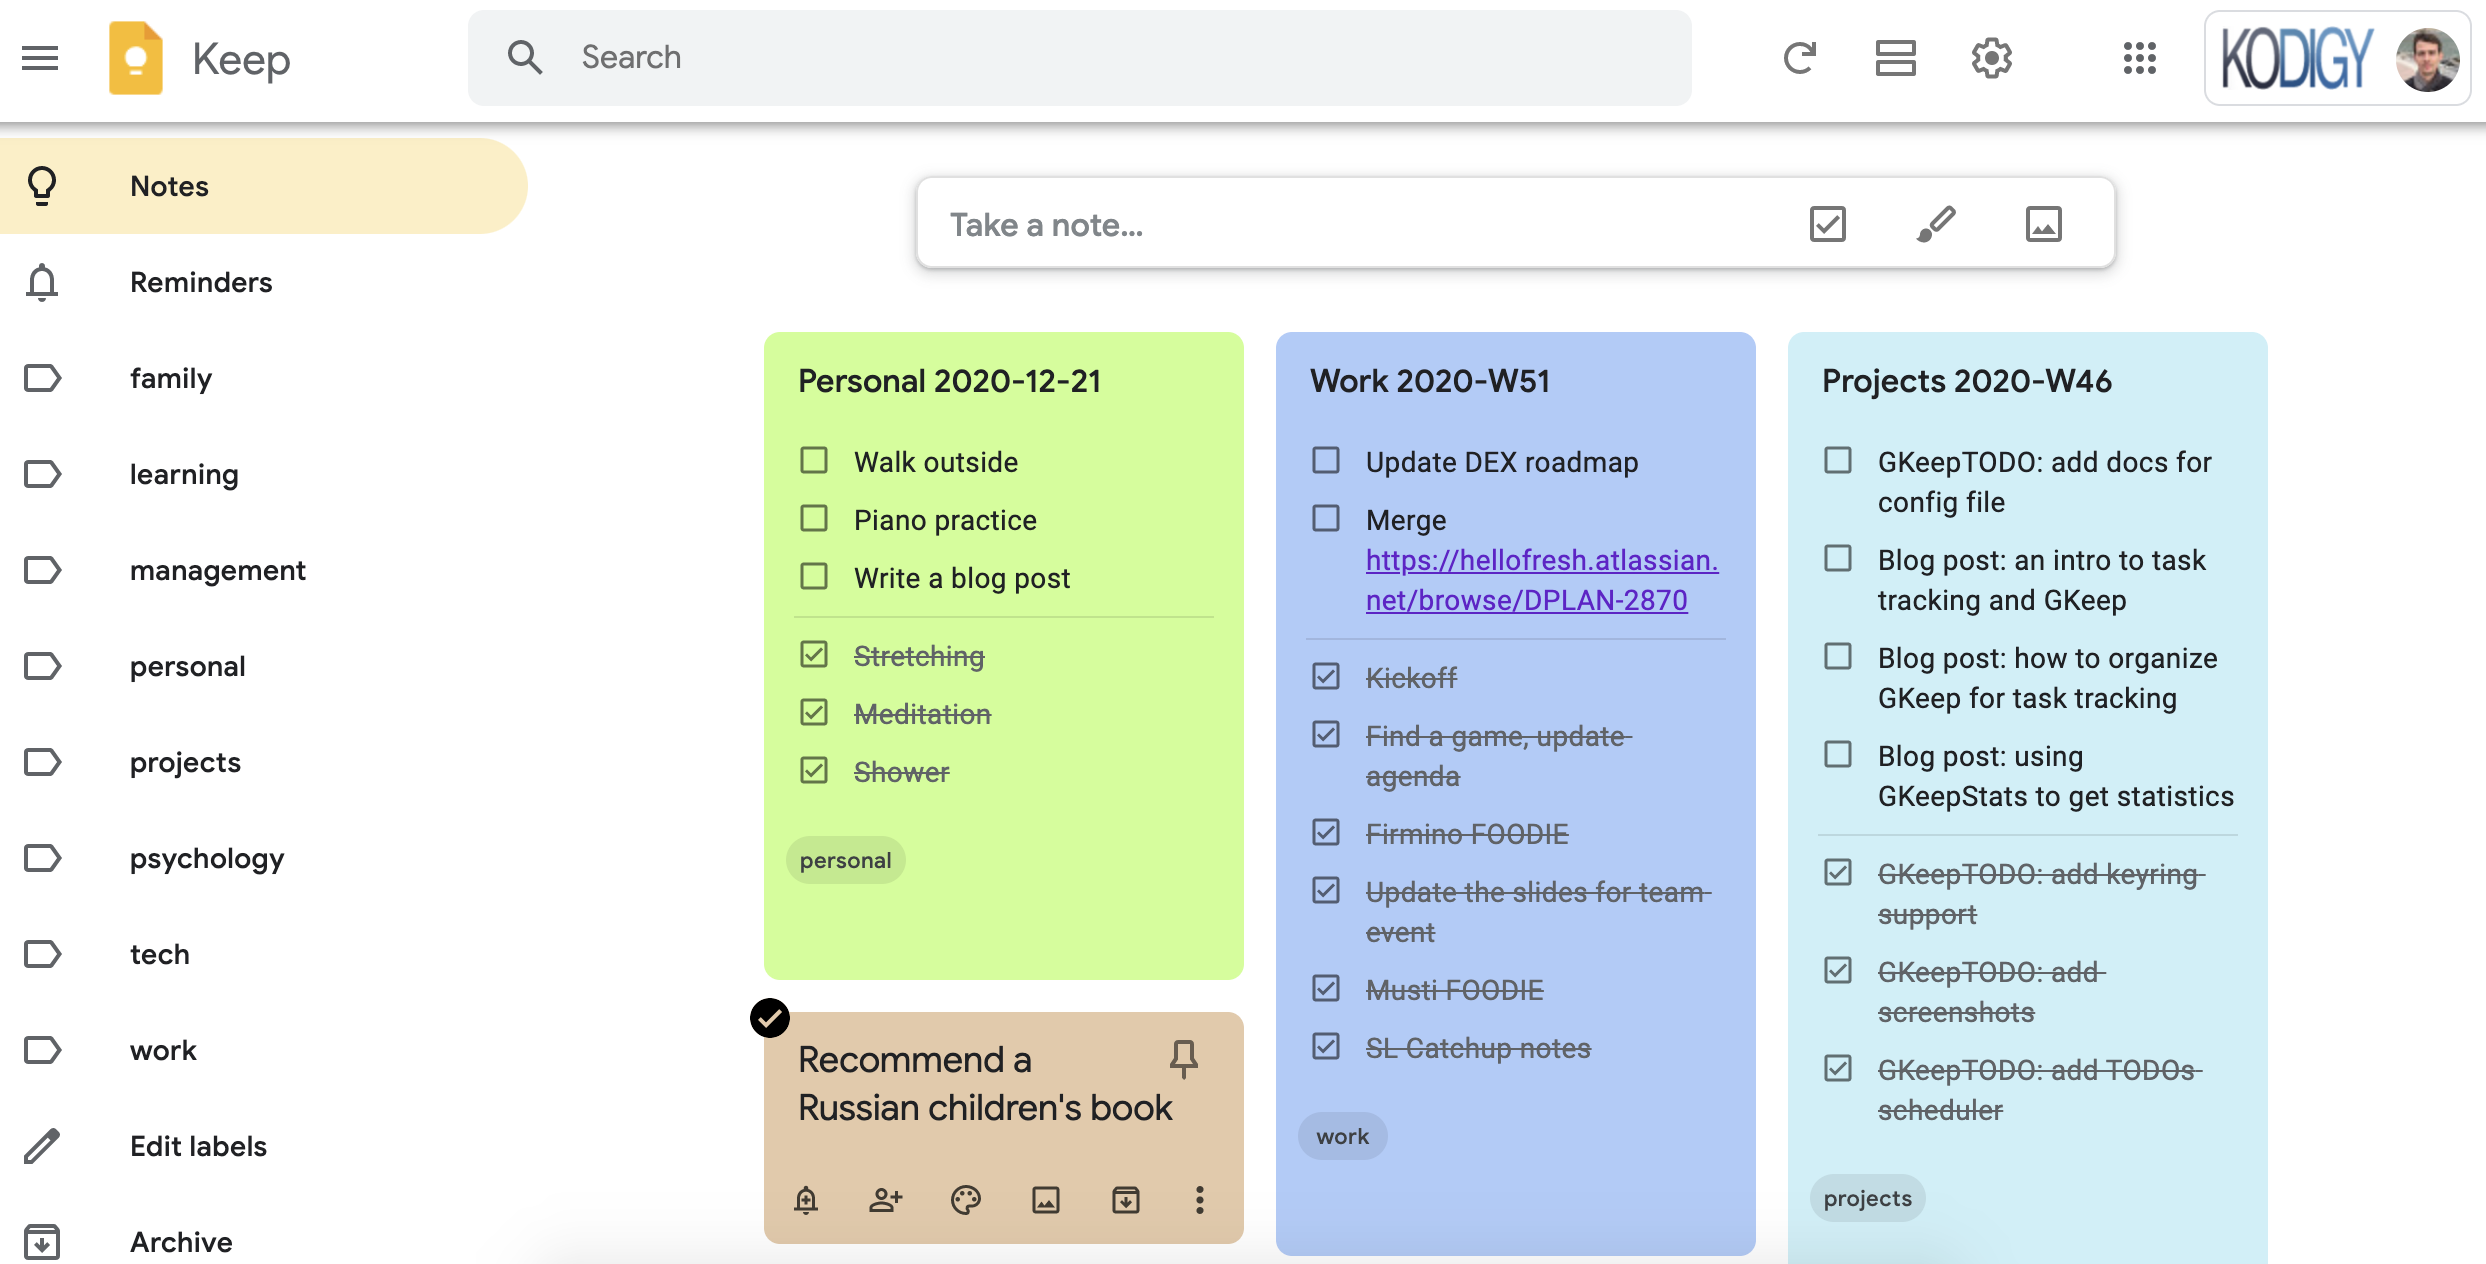
Every now and then I keep looking around and thinking of a dedicated task tracker app like Todoist, or latest and greatest all-in-one knowledge base like Notion. But every time I go back to Google Keep for 3 simple reasons:
- It is part of Google infrastructure that I’m using. Meaning that it’s free, works on all platforms, and my data is not going to vanish if this new startup goes bankrupt.
- My commitment bias, because I have already built the habit of using it, and I don’t want to bother migrating my data to somewhere else.
- I just love Google Keep’s minimalist material design! It’s so simple and natural to use. Just like if you write on colored sticky notes, and somebody carefully organizes them for you.
It’s not perfect however, and there are a couple of issues that kept me searching for alternatives. The never ending human curiosity and strive for better aside, here is something I miss in Google Keep a lot: statistics of completing tasks by category and period of time. This feature however is hard to find in other task tracking software.
So, after trying out a couple new TODO apps again, going back to Keep and longing for tracking my goal statistics, I asked myself: how hard can it be to add statistics to Google Keep?
It turned out that there is an unofficial API that allows to do that and it’s not that hard to use. But first let’s look at the way I organize my task lists in Google Keep.
TODO framework for Google Keep
Google Keep has notes and lists. I use notes for my… ehem… notes, and lists for my TODOs. I create a lot of lists for different categories and periods of time. To worry less about cluttering, I just archive the lists and notes which are not relevant anymore, and later on I can easily find them using Search function - something Google has always been great at.
Let’s look at a typical TODO list:
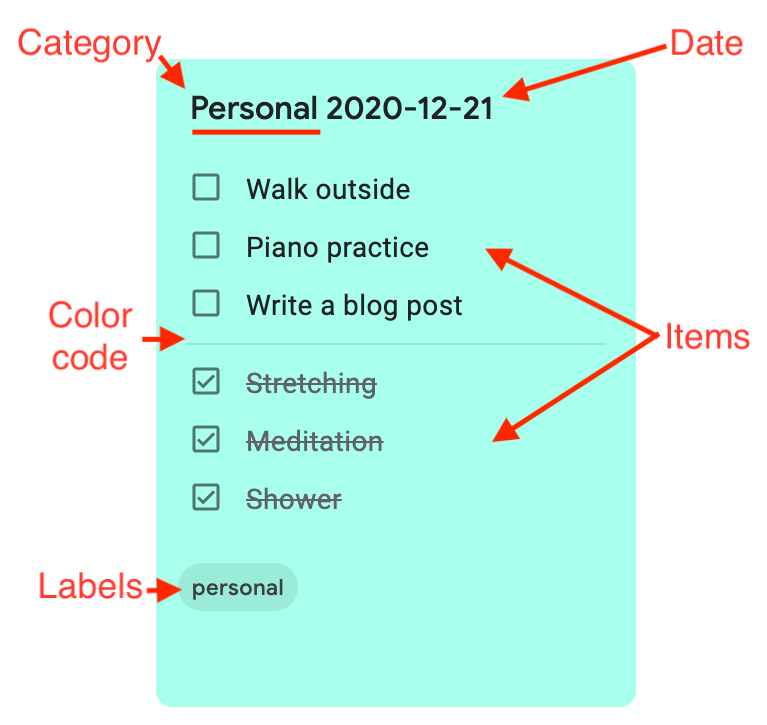
You can see the following key elements on the image:
- Category - a primary identifier that represent a certain type of tasks. Example categories I use:
Personal,Work,Household. - Color code - each category is associated with a specific color, so it is easier to tell cards belonging to one category from the other visually.
- Date - each list corresponds to a specific period of time. It can be a day, a week, a month, or a year.
- Items - the TODO tasks themselves.
- Labels - labels make it easier to find lists of certain category with just a single click on the label in the menu. Typically similar to categories.
These building blocks combined with a couple of techniques can turn the note-taking app Google Keep into a powerful task tracking system. These techniques are explained in more detail below.
Categorization
I split all my TODO lists into categories to track them separately, e.g. Personal, Work, Household. You may want to use more specific ones like Studies, Housekeeping, etc. You can even track progress on specific projects, each project being a category e.g. Project Apollo. I use very few very generic categories which represent specific spheres or types of activity. It helps me find balance to keep the lists trackable without getting lost into detail.
Assigning a color code to each category makes it easier to find a list of certain type in a pile of notes on Google Keep board. This technique also motivates me to balance lists in different categories so that a single color doesn’t dominate my Keep board. Think of enforcing work-life balance this way. Some example associations that I use: Personal: green, Work: dark blue, Household: grey, Projects: light blue.
The last element that I use for categorization is labels. It is completely optional, but I find it easier to find the notes and lists over time if I assign certain labels to them. All labels are shown in the navigation panel in Keep, and can be used as one-click filters. Most of the time my labels are the same as categories, but you can build advanced search system with them, given that multiple labels can be assigned to the same note.
Dates and time spans
Adding dates to the task lists is an essential part to track your tasks regularly and consistently. It also enables you to create cumulative reports and track goals over longer time spans.
For me the granularity of the lists depends on a category, because I don’t have the same amount of tasks and planning horizon for each of them. For example, my Work lists are weekly. I plan work tasks for the whole week and keep adding them or marking the done ones as complete as the week goes by. So, I use ISO week numbers as date stamps for these lists, e.g. 2020-W52. 2020 is the year number. I highly recommend to add the year part if you plan to use the tool more more than one year, my initial mistake was to omit it. W52 is the ISO identifier of a week number 52 of the year.
While the Work lists are weekly, my Personal tasks are daily and way more granular. I find it useful for routine tracking, habit building, and mindfulness techniques. I prefer to use the ISO date format for dates: 2020-12-30. If you’re not so much into technical formats, you can use something more traditional in your country, e.g. 30/12/2020, 30.12.2020, 30 Dec 2020.
Another way to use case for lists in Google Keep is putting your longer term goals to a visible place on the board. Such goal lists can also have date identifiers. It is more reasonable to use monthly lists (e.g. 2020-M12, December 2020, etc.), or yearly lists (2020) for yearly goals. If your long-term goals depend on progress of short-term task lists, you can use Google Keep data to build reports and visualize trends. More on that in the Statistics over time section.
Items and tracking
You can create task list items and nest sub items within items in Google Keep like this:
- Buy groceries
- Milk
- Bread
- Walk the dog
Or you can use prefixes to indicate that certain tasks belong to the same group or project, e.g.:
- [Piano] Practice C-major chord
- [Home] Hang the curtain
- [Piano] Play the Nutcracker
I prefer the lists to be just flat and don’t use nesting or prefixes. So, my TODO items are just simple imperatives like:
- Buy groceries
- Walk the dog
- Practice C-major chord
If I feel like there is a strong need for a prefix or nesting after some time, that’s a good sign that a new category is needed.
Once an item is done, it is checked as complete. Once the whole list is complete, or the time span is not relevant anymore (e.g. it’s already the week after), I archive the whole list. For example, at the end of each week I review the lists for that week, draw conclusions and archive them. All archived notes are not cluttering your main board anymore, but are still perfectly accessible via Search and Labels. This is a feature I couldn’t find in many popular TODO apps.
Cloning lists for reuse
Let’s consider a couple of common situations when you need to copy some of the items from the previous TODO, or create exactly the same list to complete the same items again.
The first situation often occurs when I finish my work week, but there are some tasks that I haven’t completed and want to carry over to the next week. This can be done rather easily with the context menu which opens when you click the three dots (...) icon in the bottom right corner of a Google Keep note.
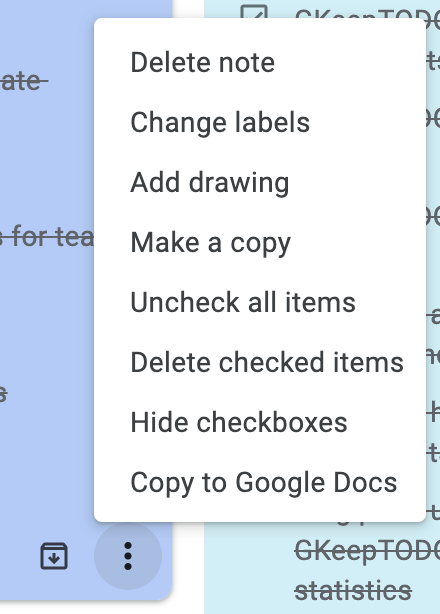
- … -> Make a copy
- In the newly created card click … -> Delete checked items
- Archive the old card and edit the new one (e.g. change the date)
The second situation occurs when working with repetitive daily tasks, such as routine or habit building. To re-create the same TODO list but for the next day:
- … -> Make a copy
- In the new card click … -> Uncheck all items
- Archive the old card and update the date in the new one
Another, a more programmer, way to automate this job is described in Planning routine tasks and habit building.
Try it out
That’s the whole framework. If you have a Google account, I encourage you to try it out at this point and see if it fits your needs. Or feel free to steal some of these ideas for TODOs in your favorite app.
If you already use Google Keep for your TODOs, and if you are a numbers/data/control freak, read on to find out how you can add statistics component on top of Google Keep.
Statistics over time
Unfortunately Google Keep doesn’t provide any statistics out of the box. But we can leverage its unofficial API to export the data and use common tools to process and visualize it.
I’ve written a simple Python script called GKeepTODO to extract statistics from Google Keep task lists. This tool can aggregate data for certain periods of time (e.g. monthly), calculate overall completion rates, and export result as CSV files. Then you can feed the CSV data into your favorite spreadsheet or chart tool, e.g. Google Docs.
With Python 3 installed on your machine, follow the installation instructions and other docs to get started. In this article I will show a simple use case.
As I’m writing this post at the end of the year, it’s the right time to see how the year went. I want to see, what % of my tasks I completed over the year. Let’s look at my Work statistics together, using the gkeeptodo script.
Collecting statistics
First, I edit the config file gkeeptodo.ini to make sure I’m going to export the correct metric:
[metric: Work]
keyword=Work
modes=monthly, total
This configuration for metric called “Work” means: “search for task lists prefixed with keyword Work, write a report aggregated by month, and also an overall report”.
Then, given that the pre-requisites are installed and the configuration file is located in current directory, I run the tool like this:
./gkeeptodo.py stats -f 2020-01-01 -t 2020-12-31
You can read the command as: “give me stats from 2020-01-01 to 2020-12-31”. The from (-f) and to (-t) arguments are optional. If omitted, the tool includes data for all time. It prints something like this:
 % ./gkeeptodo.py stats -f 2020-01-01 -t 2020-12-31
Loading access token from keyring
Authorization, this may take a while...
Collecting metrics
--------------------------------
Keyword: Work
Statistics in "total" mode
Statistics in "monthly" mode
--------------------------------
It generated CSV files: Work_monthly_20201225115355.csv, Work_total_20201225115355.csv.
The total statistics are very short and straightforward. After opening the file I see something like this:
| Index | Checked | Unchecked | Total | Completion |
|---|---|---|---|---|
| total | 425 | 123 | 548 | 0.7755474452554745 |
Woohoo! I completed 78% of my work TODOs in 2020! That’s a really good progress, as in 2019 it was at around 63%. I could get these numbers for 2019 quickly on the screen without writing the files with this command:
./gkeeptodo.py stats -f 2019-01-01 -t 2019-12-31 -d -v
Loading access token from keyring
Authorization, this may take a while...
Collecting metrics
--------------------------------
Keyword: Work
Statistics in "total" mode
Point "total": 445 checked, 259 unchecked, 704 total, completion 63%
----
The -v option means “verbose” and the -d one means “dry” or “don’t write files”.
Sidenote: the above numbers are real. You may read them as “this guy fucked up 40% of his work tasks last year, they probably fired him”. This is not correct. I keep track of all the things that potentially should be done, not only the ones that absolutely must be done. If you are familiar with the Eisenhower matrix, those statistics are for all 4 quadrants.
I put the important stuff on the top of the lists and try to complete them first, while less important tasks stay at the bottom and often get rejected in favor of more important ones. Given this, I consider 75% to be a good target for an average completion rate. 100% completion would mean that my TODO lists are too rigid and don’t include any minor things which stay untracked and invisible.
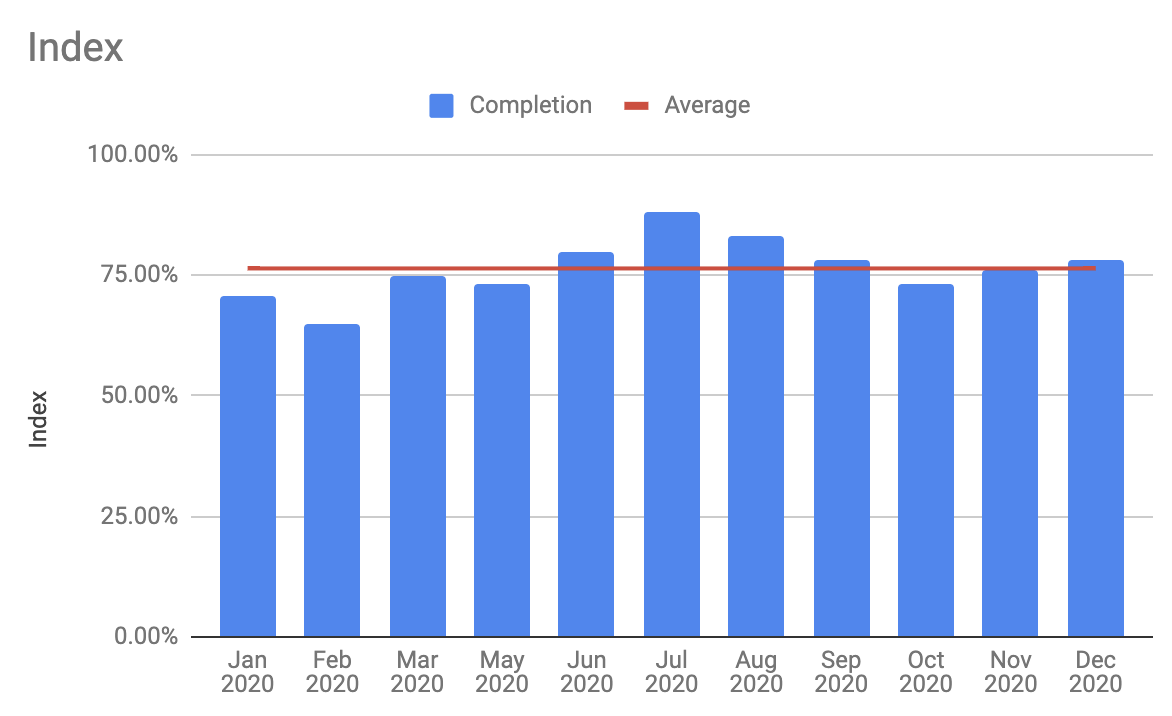
Visualizing results
CSV data is cool for Python and robots, but we are humans and we prefer visual information. Let’s import the monthly file in Google Sheets and visualize it in a chart that shows month by month completion rate with an average. Here is a step-by-step instruction how to do it.
First, open Google Docs, create a new Google Sheets document. Go to menu File -> Import and upload the CSV file. Imported data looks somewhat like this:
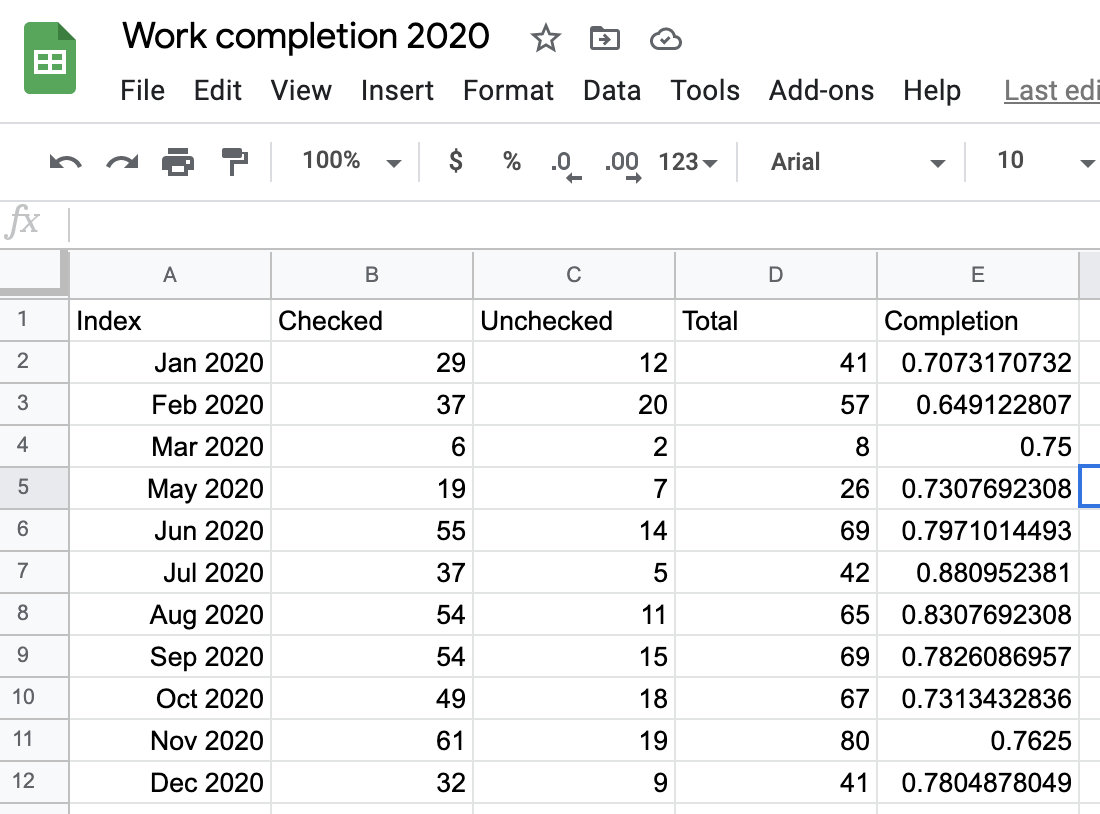
The “Completion” is not very human-friendly. You can change the display format to percent by selecting column C and using menu Format -> Number -> Percent.
We will need the average numbers to draw an average on the chart, so let’s add it in column F. Just use the =AVERAGE(E2:E12) formula and apply it to each value in the column F.
To visualize this data on a chart, select Insert -> Chart. By default it creates the “Checked vs. Index” chart. Let’s change it to visualize “Completion vs. Index” with an average. In the chart setup:
- choose
Combo chartas the Chart type - change Data range to
A1:F12 - then change Series to
Completion - add another series with
Average
The result looks somewhat like this:
The output format of this Python script is universal enough, so you can use any document suite or data tool to play with it. At this point, only completion statistics is collected. I also have ideas about adding frequency analysis to check how often a specific task appears in the TODOs and to rank the tasks by frequency. But I don’t have a real use case for this feature, so if you really want it, file a feature request on GitHub, or (even better) open a Pull Request.
Planning routine tasks and habit building
Habit building is a big thing nowadays. The books on it are extremely popular: “The Power of Habit”, “Atomic Habits”, etc. You can call it a habit revolution. Everyone wants to build healthy habits and transform their life by doing small routine steps every day.
With my TODOs already in Google Keep, I wanted to start tracking daily habit-building routines in the same app for quite a while. What was stopping me is the routine part of the routine: having to add the same tasks every day manually.
The built-in way to do it via Google Keep interface is already described in Cloning lists for reuse above. Here is a more geeky way based on scripts and templates.
Recently I added a planner tool to gkeeptodo which can schedule task lists for a given date range from a template. So, I just created a template in the config file like this:
[template: Habits]
title=Habits {date}
mode=daily
items=Shower, Meditate, Walk outside, Workout, Practice piano
labels=personal
color=green
Then I use the tool to generate task lists for the next few days, e.g.:
./gkeeptodo.py plan -f 2021-01-01 -t 2021-01-07
The above command added 7 task lists to my Google Keep looking like this:

The only thing that is different between the generated tasks is date. After adding the task lists can be edited and rearranged as needed. After all generated task lists have been used and archived, I add the next bunch of task lists with the same tool. In the meantime I can easily adjust the template for the next batch.
Conclusion
Google Keep is a very simple yet powerful application. It is a bit rigid in terms of features and automation of routine tasks. But with a bit of creativity it can be fitted for your very own needs.
Maybe after reading this article you made a conclusion that it is no fit for you. Even better! Same approach applies to any other tool, so you can explore how to adapt it to your actual needs to get your tasks organized.
As a common wisdom says: the best tool is the tool that you know.